Works
Risk Identifier
Operational Readiness Dashboard
Risk Identifier shows how ready a product is for real-world use by surfacing key risks early, with a clear Operability Score.

Role: UX/UI Product Designer & Researcher
Led design as the solo designer, collaborating closely with the UX/UI manager, project manager, and front-end/back-end development teams | Amdocs 2024-2025

Business problem
Fragmented project tracking forced leaders to chase manual updates across emails and Gantt charts for dozens of projects, hiding risks until budgets overran and deadlines missed—costing time, money, and customer trust.

What was the challenge?
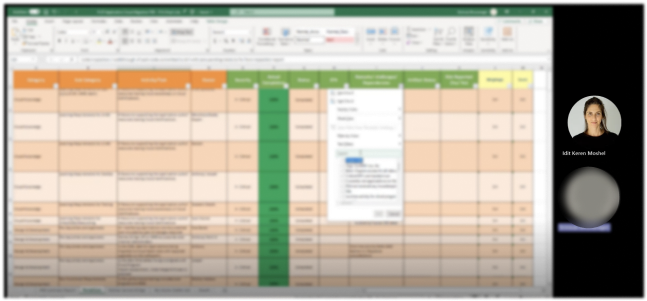
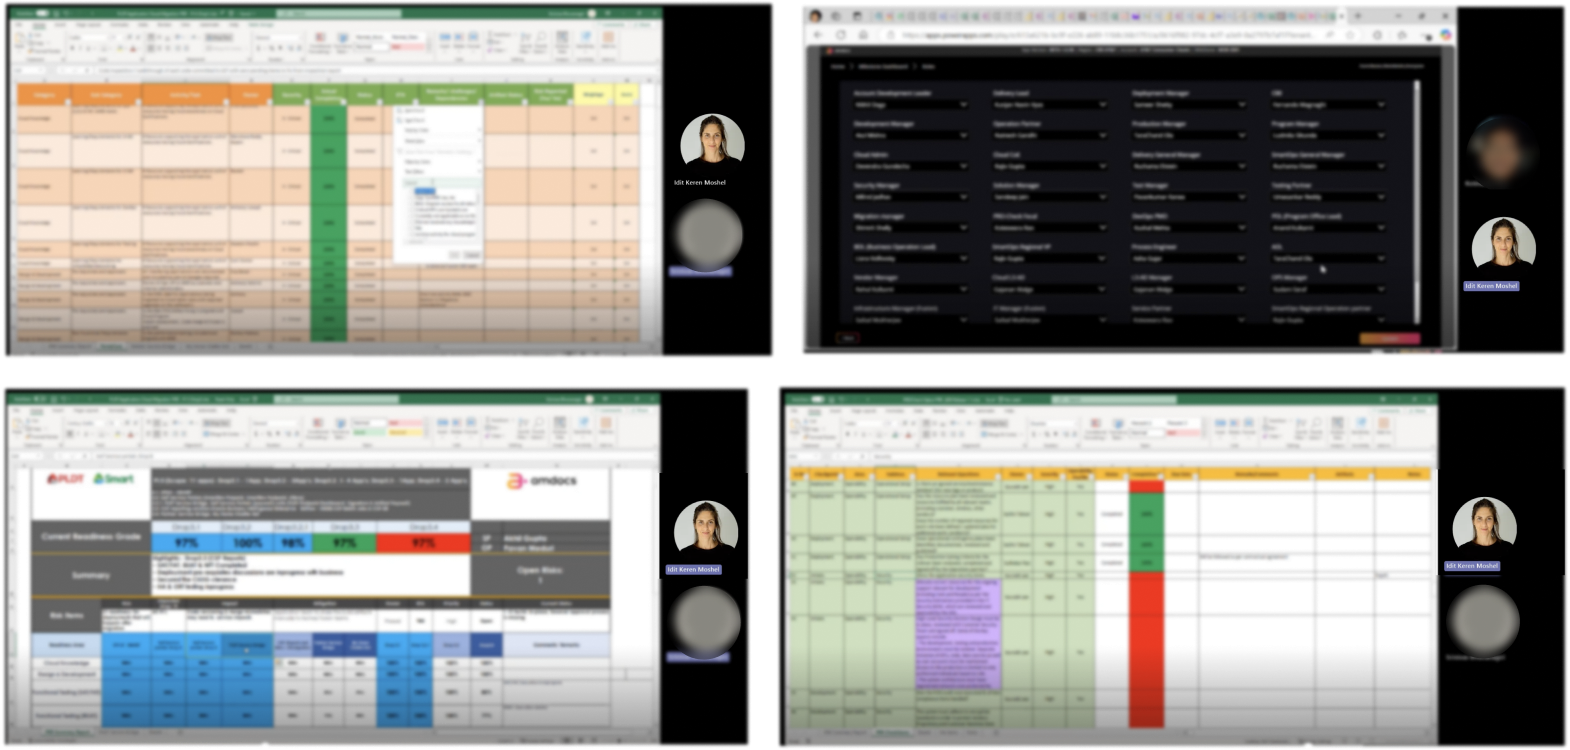
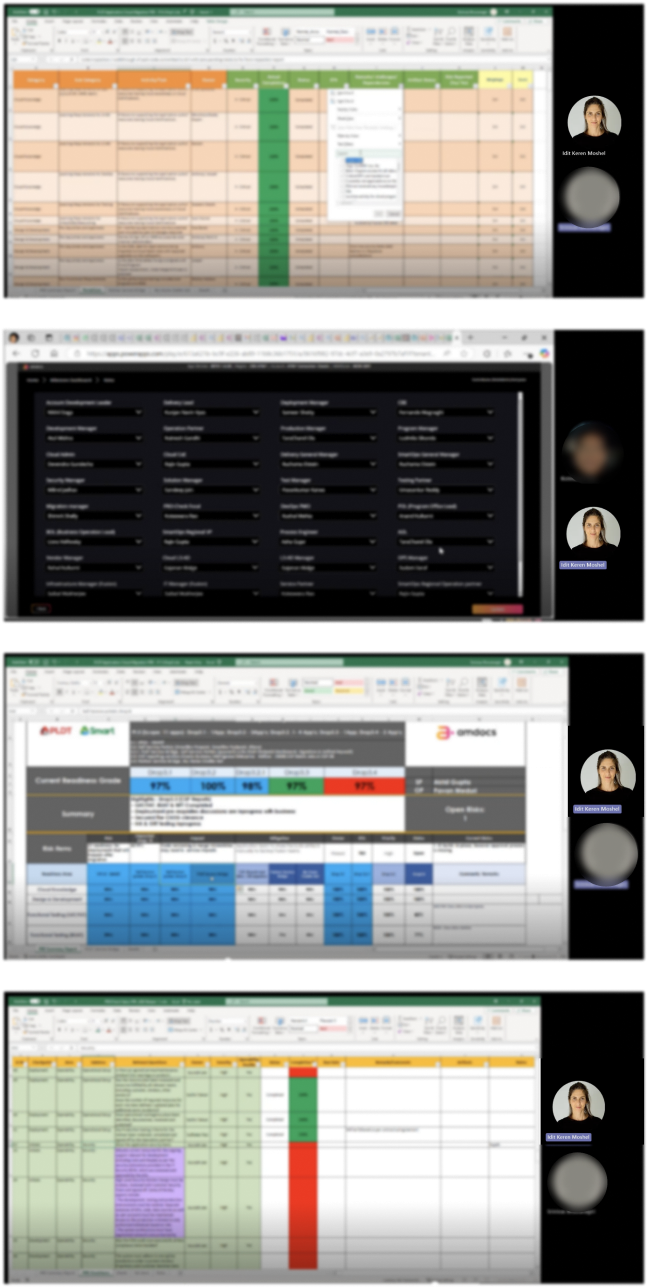
Senior stakeholders managed dozens of parallel projects using Excel Gantt charts and manual status emails, making it impossible to understand true delivery risk. Risks only surfaced late—when deadlines slipped or budgets overran—leaving no time to allocate critical resources like architects or QA.

What was the aim?
Create a unified dashboard that consolidates milestones by phase (Init, Dev, QA, etc.) across all projects, giving leaders real-time risk visibility and enabling proactive resource allocation before problems escalate.

What were the requirements?
Focus
Moving towards Operability
Questions
Templates based
Tools
Driven by PowerApps tool
(digitization & automation)
Standardization
Integrated within the process, this framework ensures Agile compliance.
Ownership
Accountability – Service Partner
Responsibility - Operation Partner
Coverage
3 Milestones

What was the process?
Question Bank (QB)
Best practices QB
QB modification based on Lesson Learn
Ongoing QB maintenance
Meta Data Collection
Release Type
Release Date
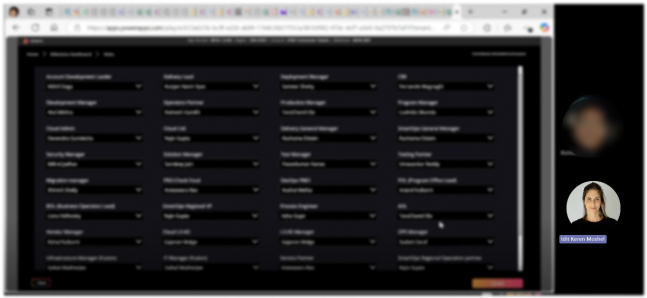
Stakeholders
Timelines
Checkpoints
Risk Identifier Execution
Check list from QB based on release type
Checklist execution across phases
Raise risk in Account Risk Register
Additional question can be added by account
Risk Management
Review risks in account Risk Register
Mitigate/Accept risk as per account GBD Risk Management Process
Approve completion/release post Risk Assessment
Who are the users?

Portfolio Manager
Juggling budgets across teams with no real-time view—wants consolidated milestones to catch overruns before they hit financials.


VP Engineering
Tracks 30+ projects daily but drowns in Excel Gantts and email updates—needs one dashboard to spot risks early and prioritize architects.


Resource Lead
Gets frantic "urgent" requests when QA bottlenecks emerge—needs phase-by-phase visibility to allocate her team proactively.


CTO
Senior exec who needs cross-project risk signals at a glance to brief the board, not chase manual status reports.
Time for research
I used three research methods:

1. User Interviews
Direct conversations with users to understand their goals, workflows, and pain points in real-world contexts.

2. Card Sorting
A research method used to Reveal how users group and label information.

3. Usability Test
Observing users as they complete tasks to identify usability issues and validate design decisions.
1 . User Interviews
I interviewed Excel Gantt users to uncover daily tracking pain points.
2. Card Sorting
Organized user interview pain points and needs into clear categories.
Efficiency
"I'm frustrated by unexpected issues that arise after the product launch, which could have been prevented with better planning."
Efficiency
"I feel disconnected from development and doubt my needs are considered, causing product dissatisfaction."
Complexity
I'm overwhelmed by the complexity of this Excel file that multiple people are working on."
Complexity
Big Excel file is causing confusion and making it hard to find the information I need." -split to 2 sentence
Trust
"The system feels unstable, slowing my tasks and hurting productivity."
Visualization:
Clear Visualization: "I find it hard to understand the workflow because the map is cluttered and not intuitive."

3. Usability Test- Success Criteria
Goal: Validate Users easily find projects relevant info without workarounds.

Efficiency - Preventing Post-Launch Issues
Participant identifies missing QA resources
Participant notices database migration hasn't started
Participant recognizes stale status update
Disconnected from Development
Participant locates their requirement
Participant identifies lack of progress/closure
Participant can escalate or add follow-up
Complexity - Finding Information
Participant uses search/navigation to find project
Participant identifies who last updated the data
Time to find information: < 90 seconds
Visualization - Cluttered Workflow Maps
Participant views workflow visualization
Participant identifies QA Testing bottleneck
Participant understands dependencies
Exploring Early Directions
Initial Testing Mockups and Design Alternatives
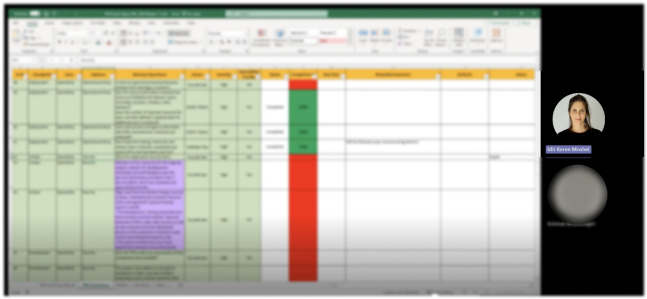
Checkpoint Management Assessment (Product Requirement)
Original product sketch: Users had to fill dense panels with stacked forms and tables for checkpoint assessments- too cramped, no clear sequence, and required manual matching post-entry.
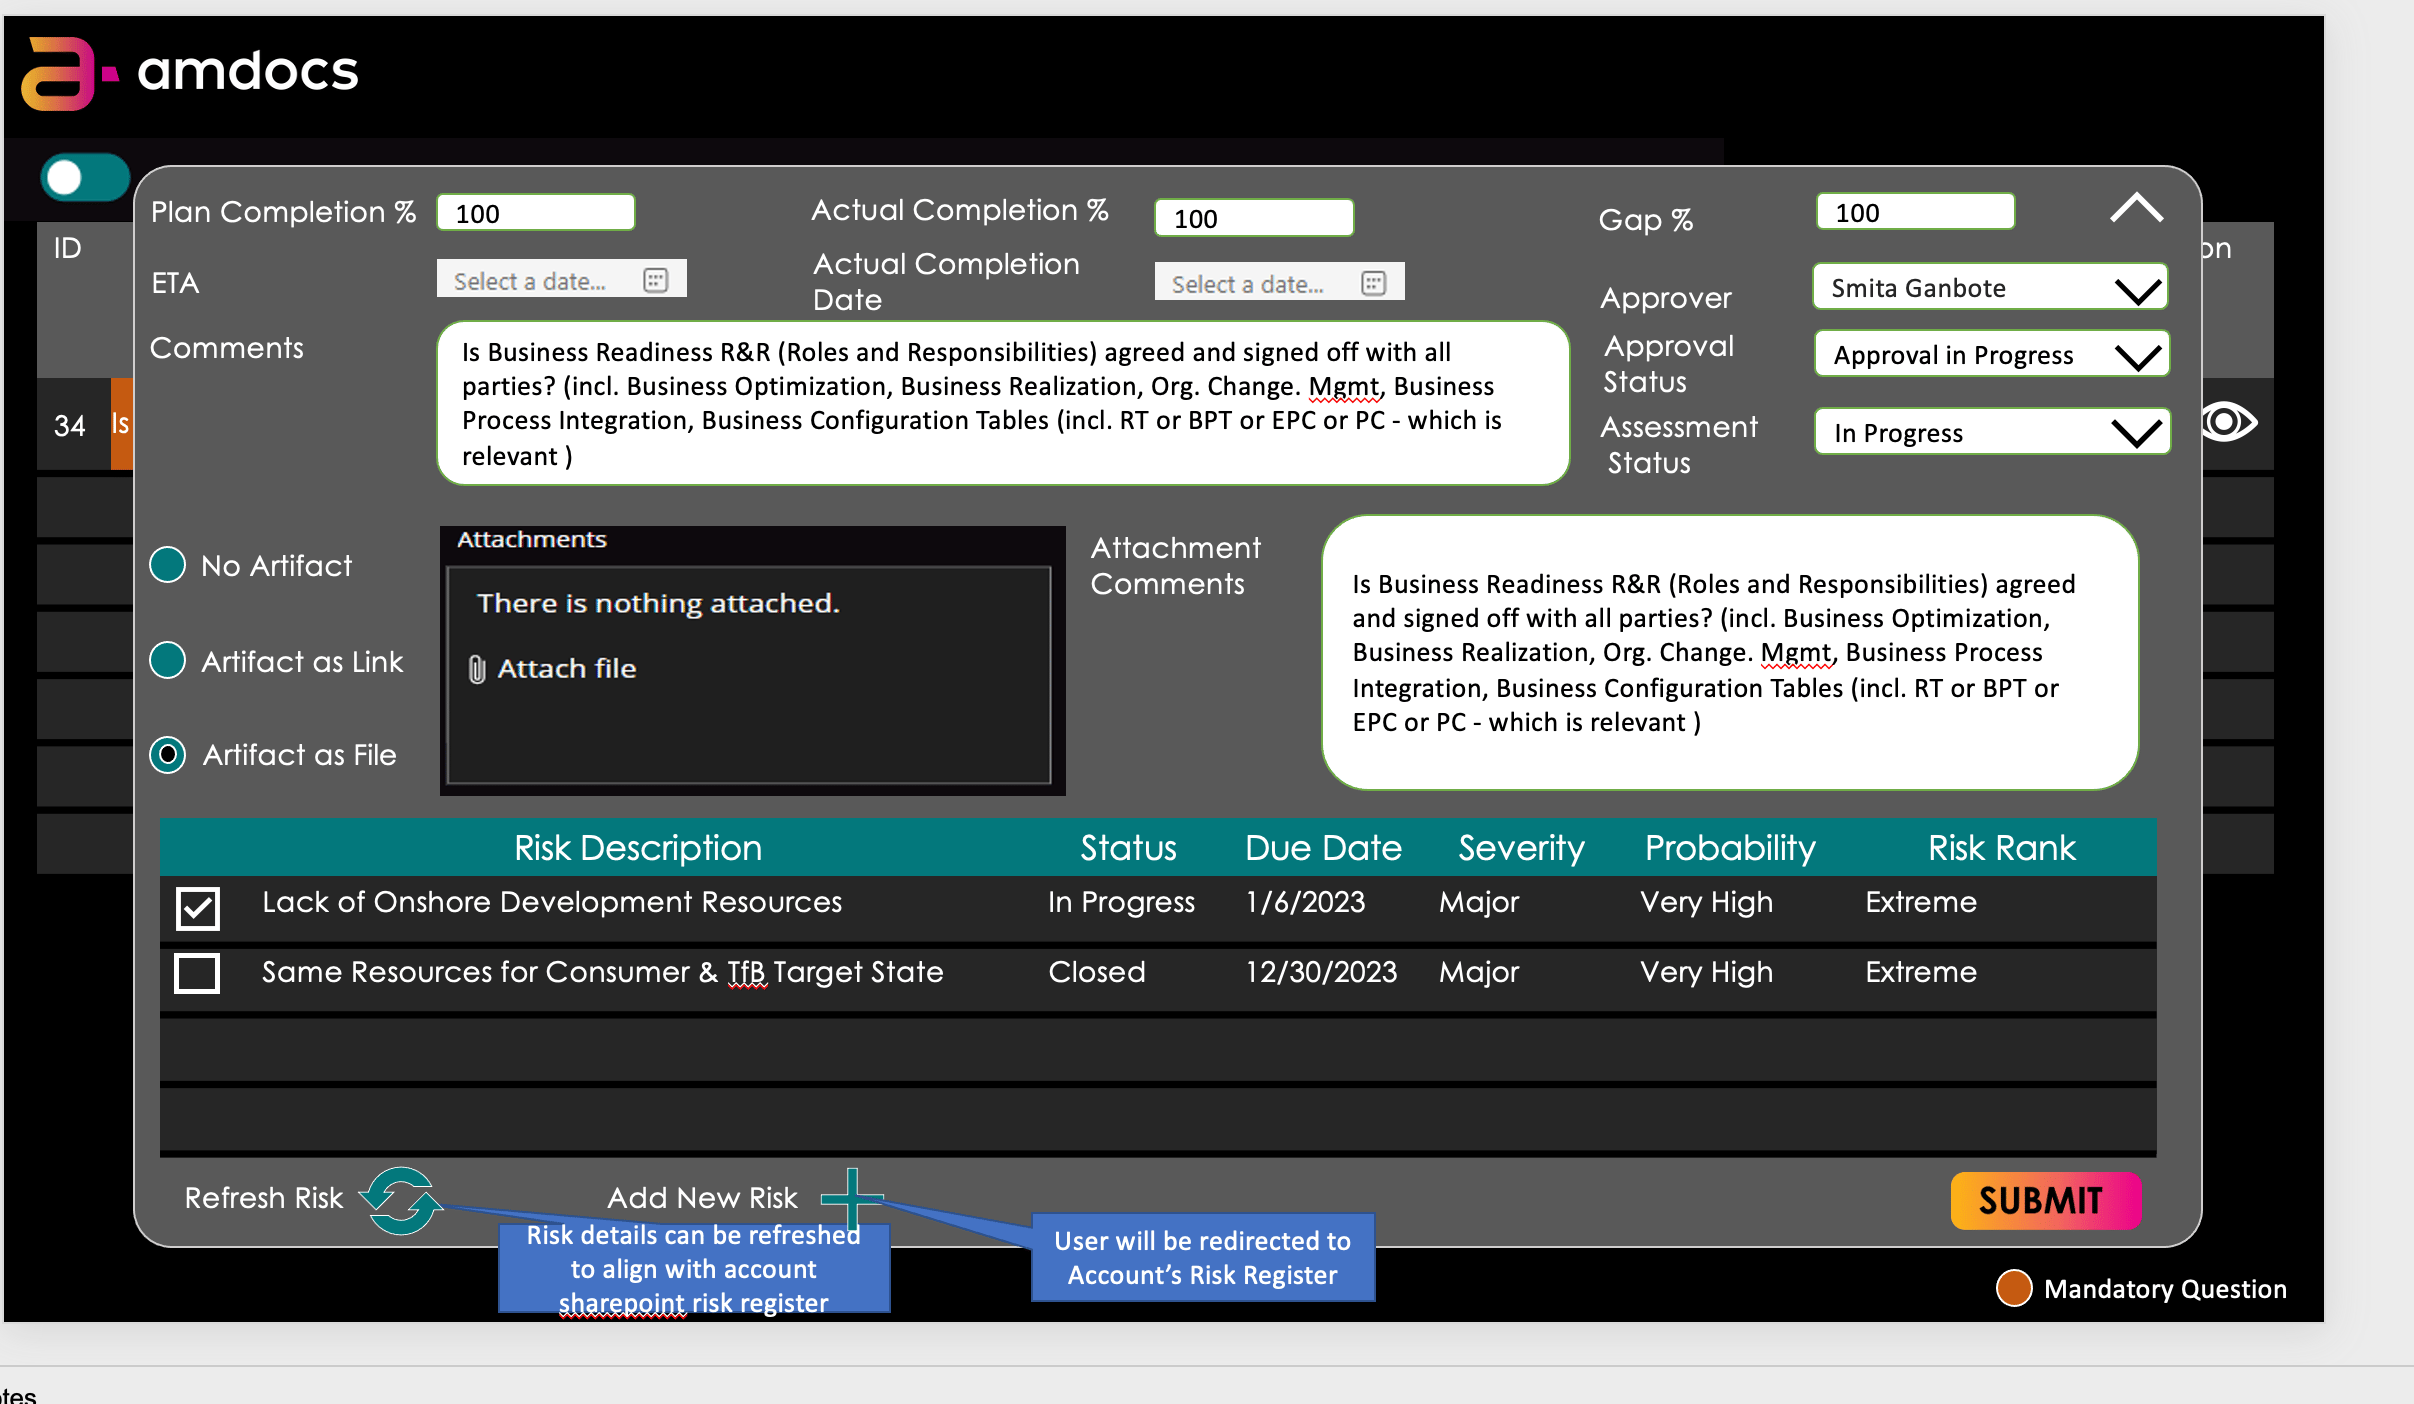
My redesign
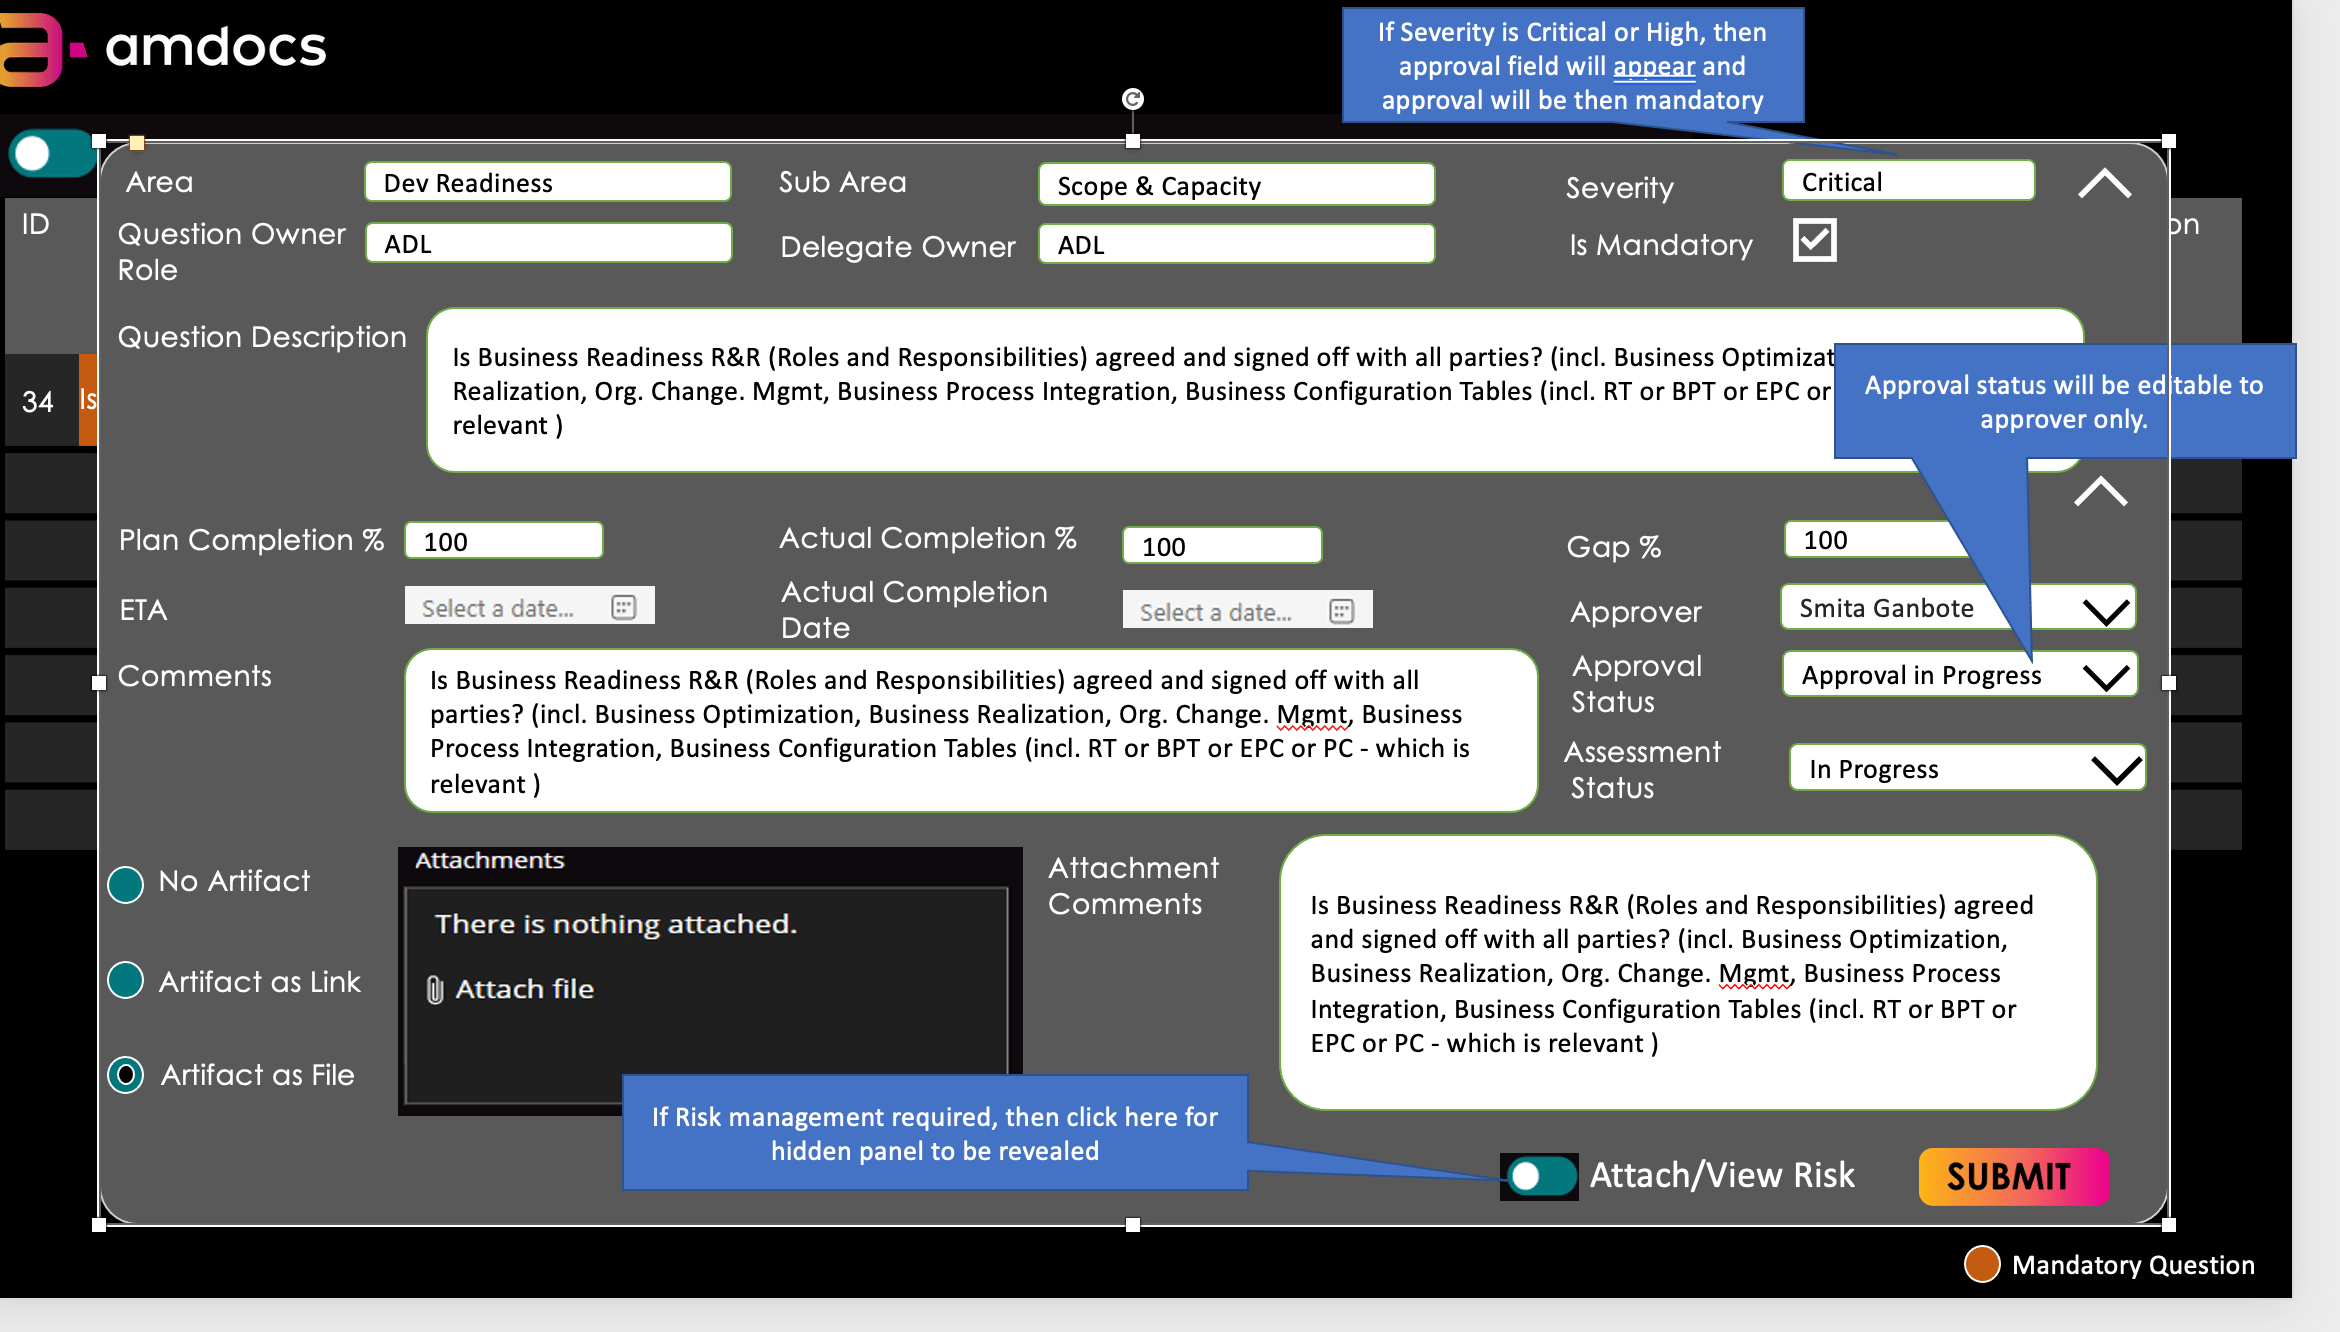
Turned this into a guided 3-step flow: input → auto-validation → smart linking with previews, making assessments intuitive and error-proof.
Checkpoint Management Assessment
Details

Area
Dev Readiness
Sub Area
Scope & Capacity
Severity
Critical
Delegate Owner
ADL
Question Owner Role
ADL
Question Creator
Tom Hirsh
Question Description
Is Business Readiness R&R (Roles and Responsibilities) agreed and signed off with all parties? (incl. Business Optimization, Business Realization, Org. Change. Mgmt, Business Process Integration,Business Configuration Tables (incl. RT or BPT or EPC or PC - which is relevant )

Is Mandatory
Assessment
Planned Completion %
100
Actual Completion %
100
Gap %
100
Approver
Select Date

Approval Status
Approval in Progress
Assessment Status
In Progress
ETA
Select Date


Actual Completion Date
Select Date
Comments
Is Business Readiness R&R (Roles and Responsibilities) agreed and signed off with all parties? (incl. Business Optimization, Business Realization, Org. Change. Mgmt, Business Process Integration,Business Configuration Tables (incl. RT or BPT or EPC or PC - which is relevant )
*
Approver Comments
Is Business Readiness R&R (Roles and Responsibilities) agreed and signed off with all parties? (incl. Business Optimization, Business Realization, Org. Change. Mgmt, Business Process Integration,Business Configuration Tables (incl. RT or BPT or EPC or PC - which is relevant )
*
Approver Comments
Is Business Readiness R&R (Roles and Responsibilities) agreed and signed off with all parties? (incl. Business Optimization, Business Realization, Org. Change. Mgmt, Business Process Integration,Business Configuration Tables (incl. RT or BPT or EPC or PC - which is relevant )
PLS provide a reason


No Artifact
Artifact as Link
Artifact as File
Risk Management

Present Risks
Save Changes
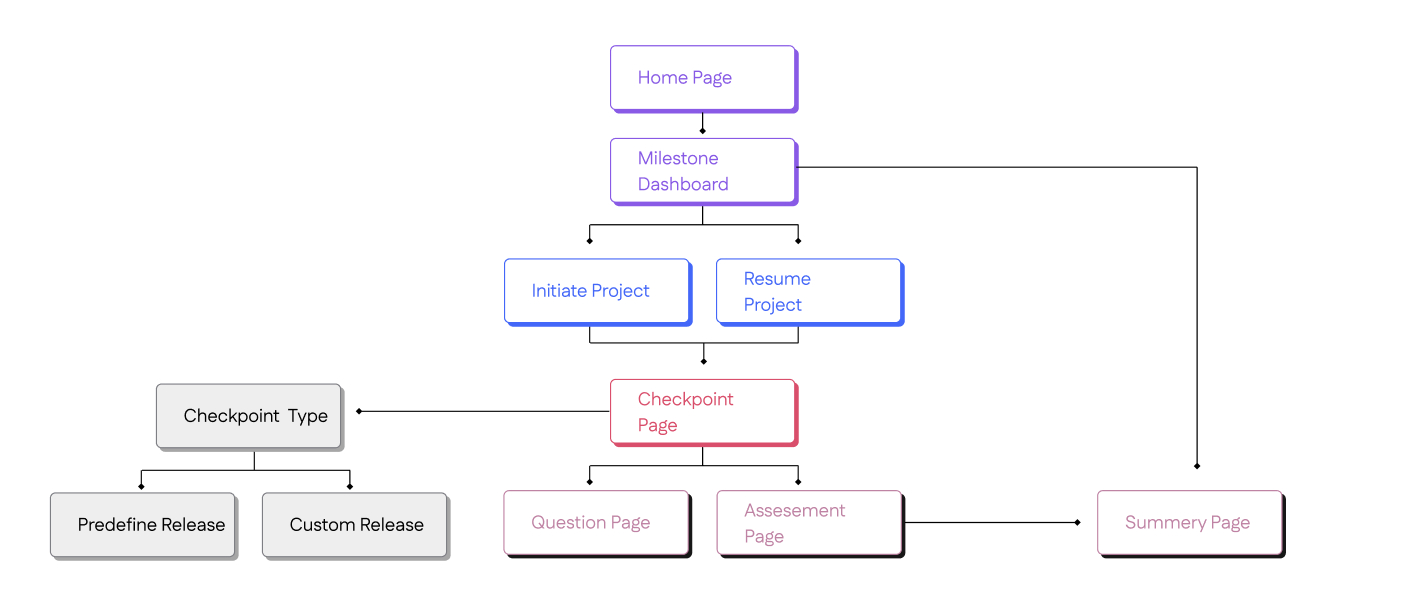
Information Architecture
Before starting design, I created an Information Architecture to organize user flows, clarify component relationships, establish scalable patterns, and align stakeholders early.
UX/UI Design Decisions
- Overview first, details on demand—executives stay high-level while PMOs drill into specifics when needed.
- Color-coded indicators let users scan dozens of projects in seconds and spot critical issues instantly.
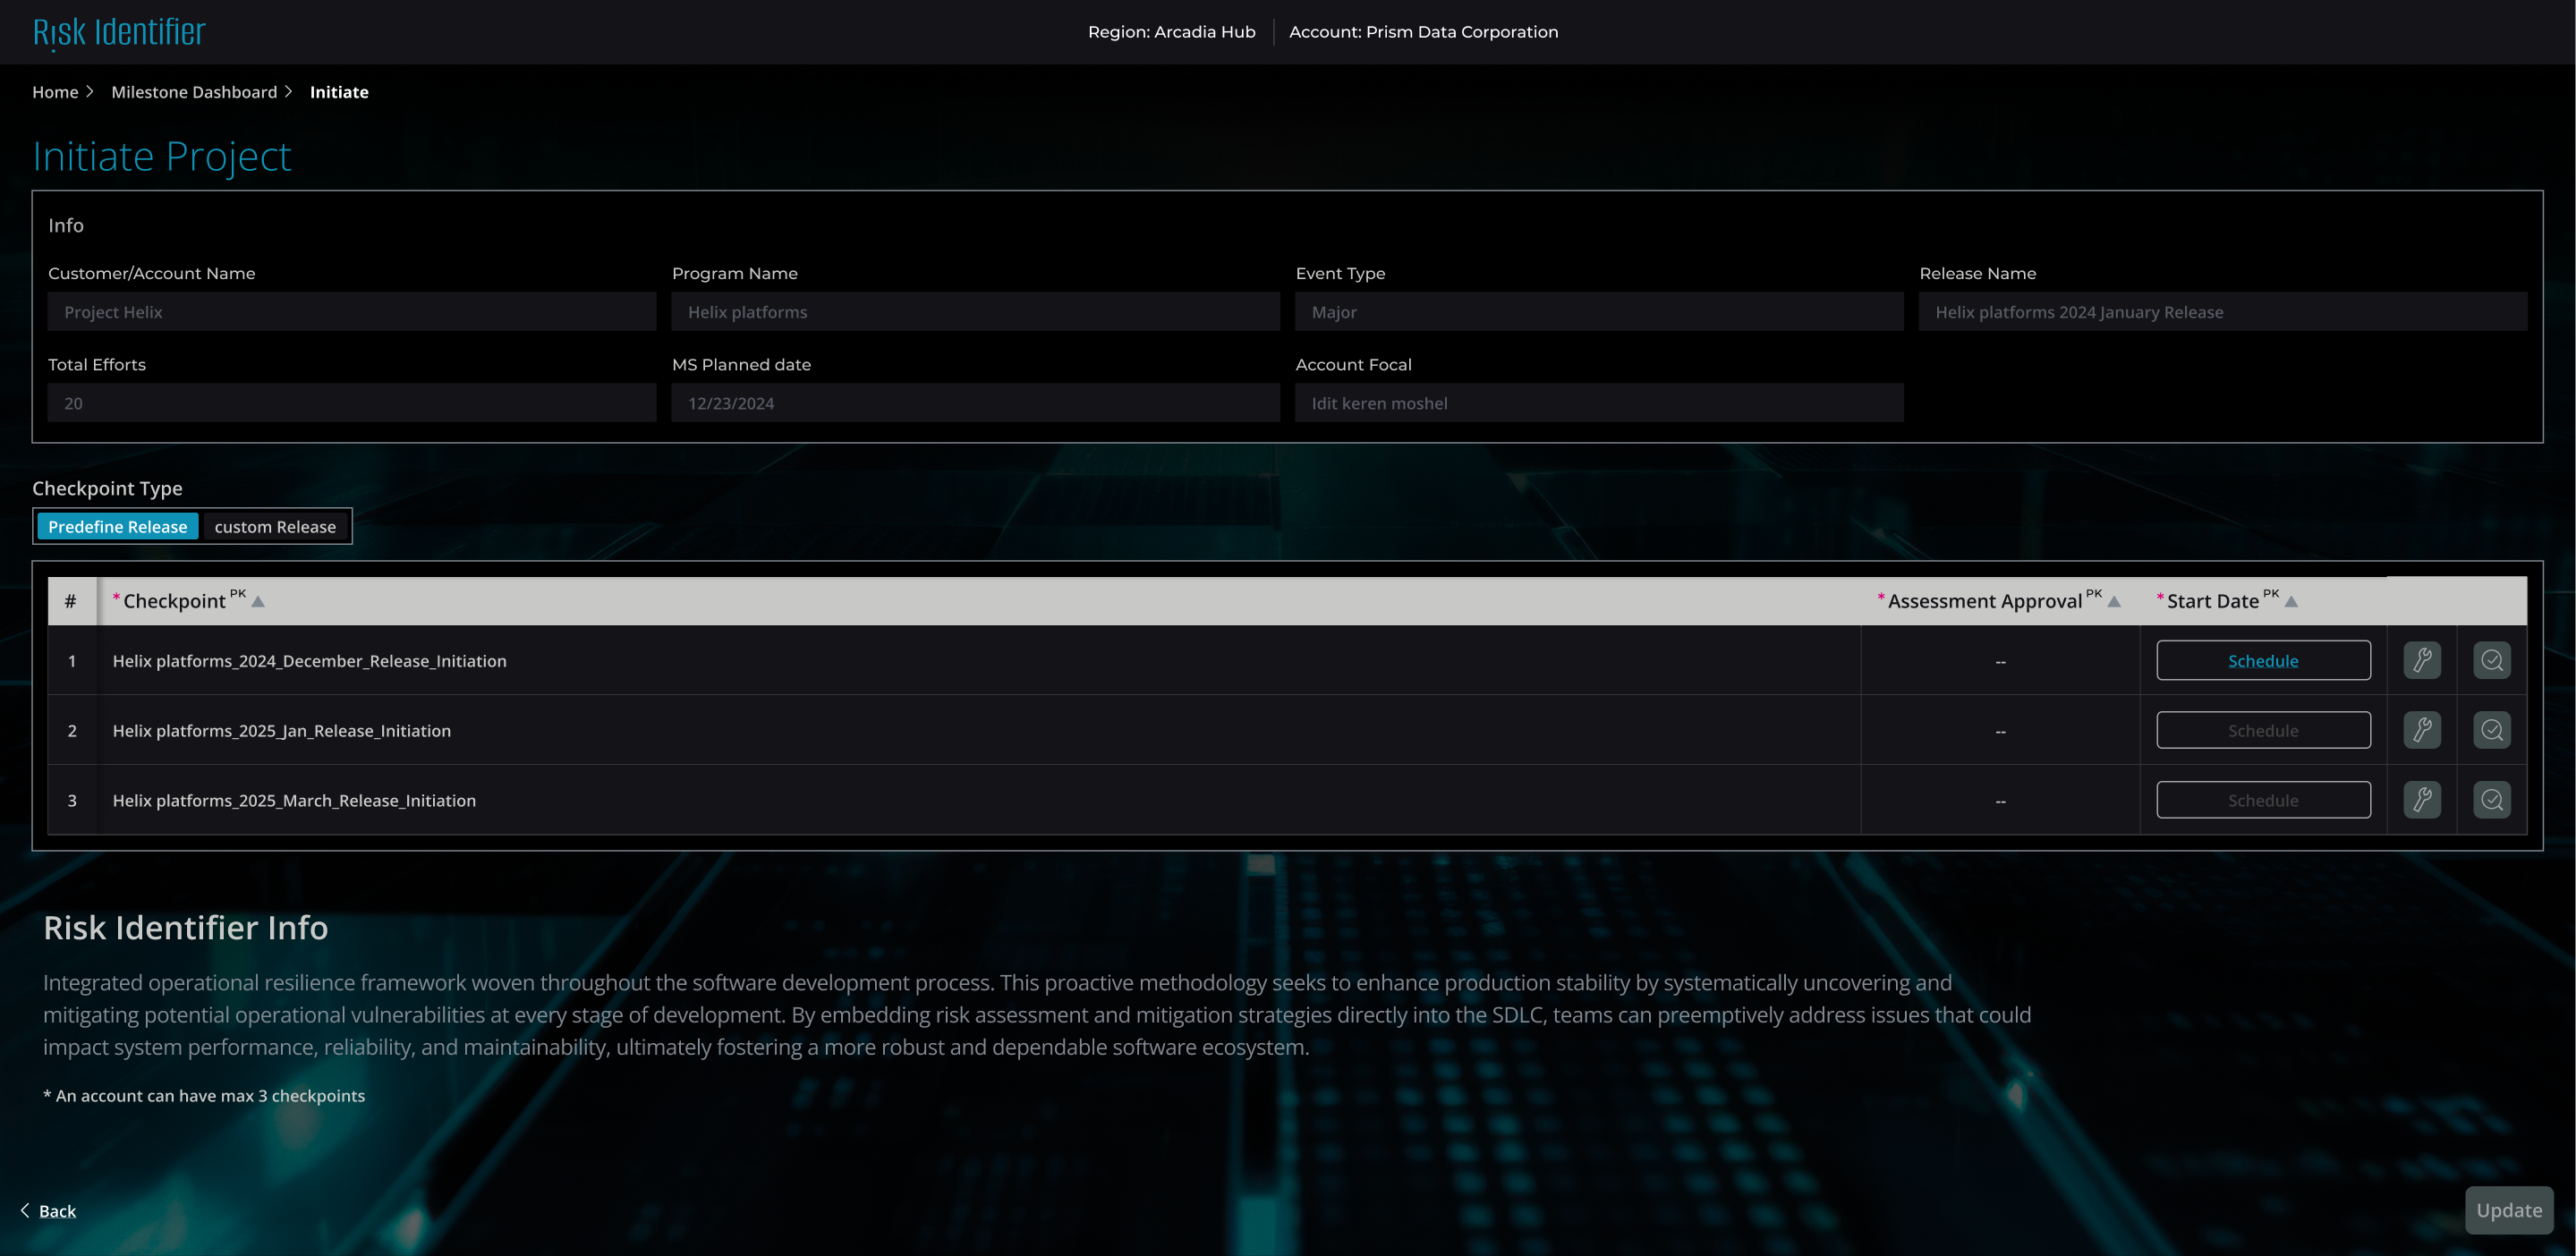
- Pre-populated checkpoints and dropdowns minimize manual entry and cognitive load during setup.
- Clear hierarchy with alternating rows, filters, and right-aligned actions for quick scanning and decisions.
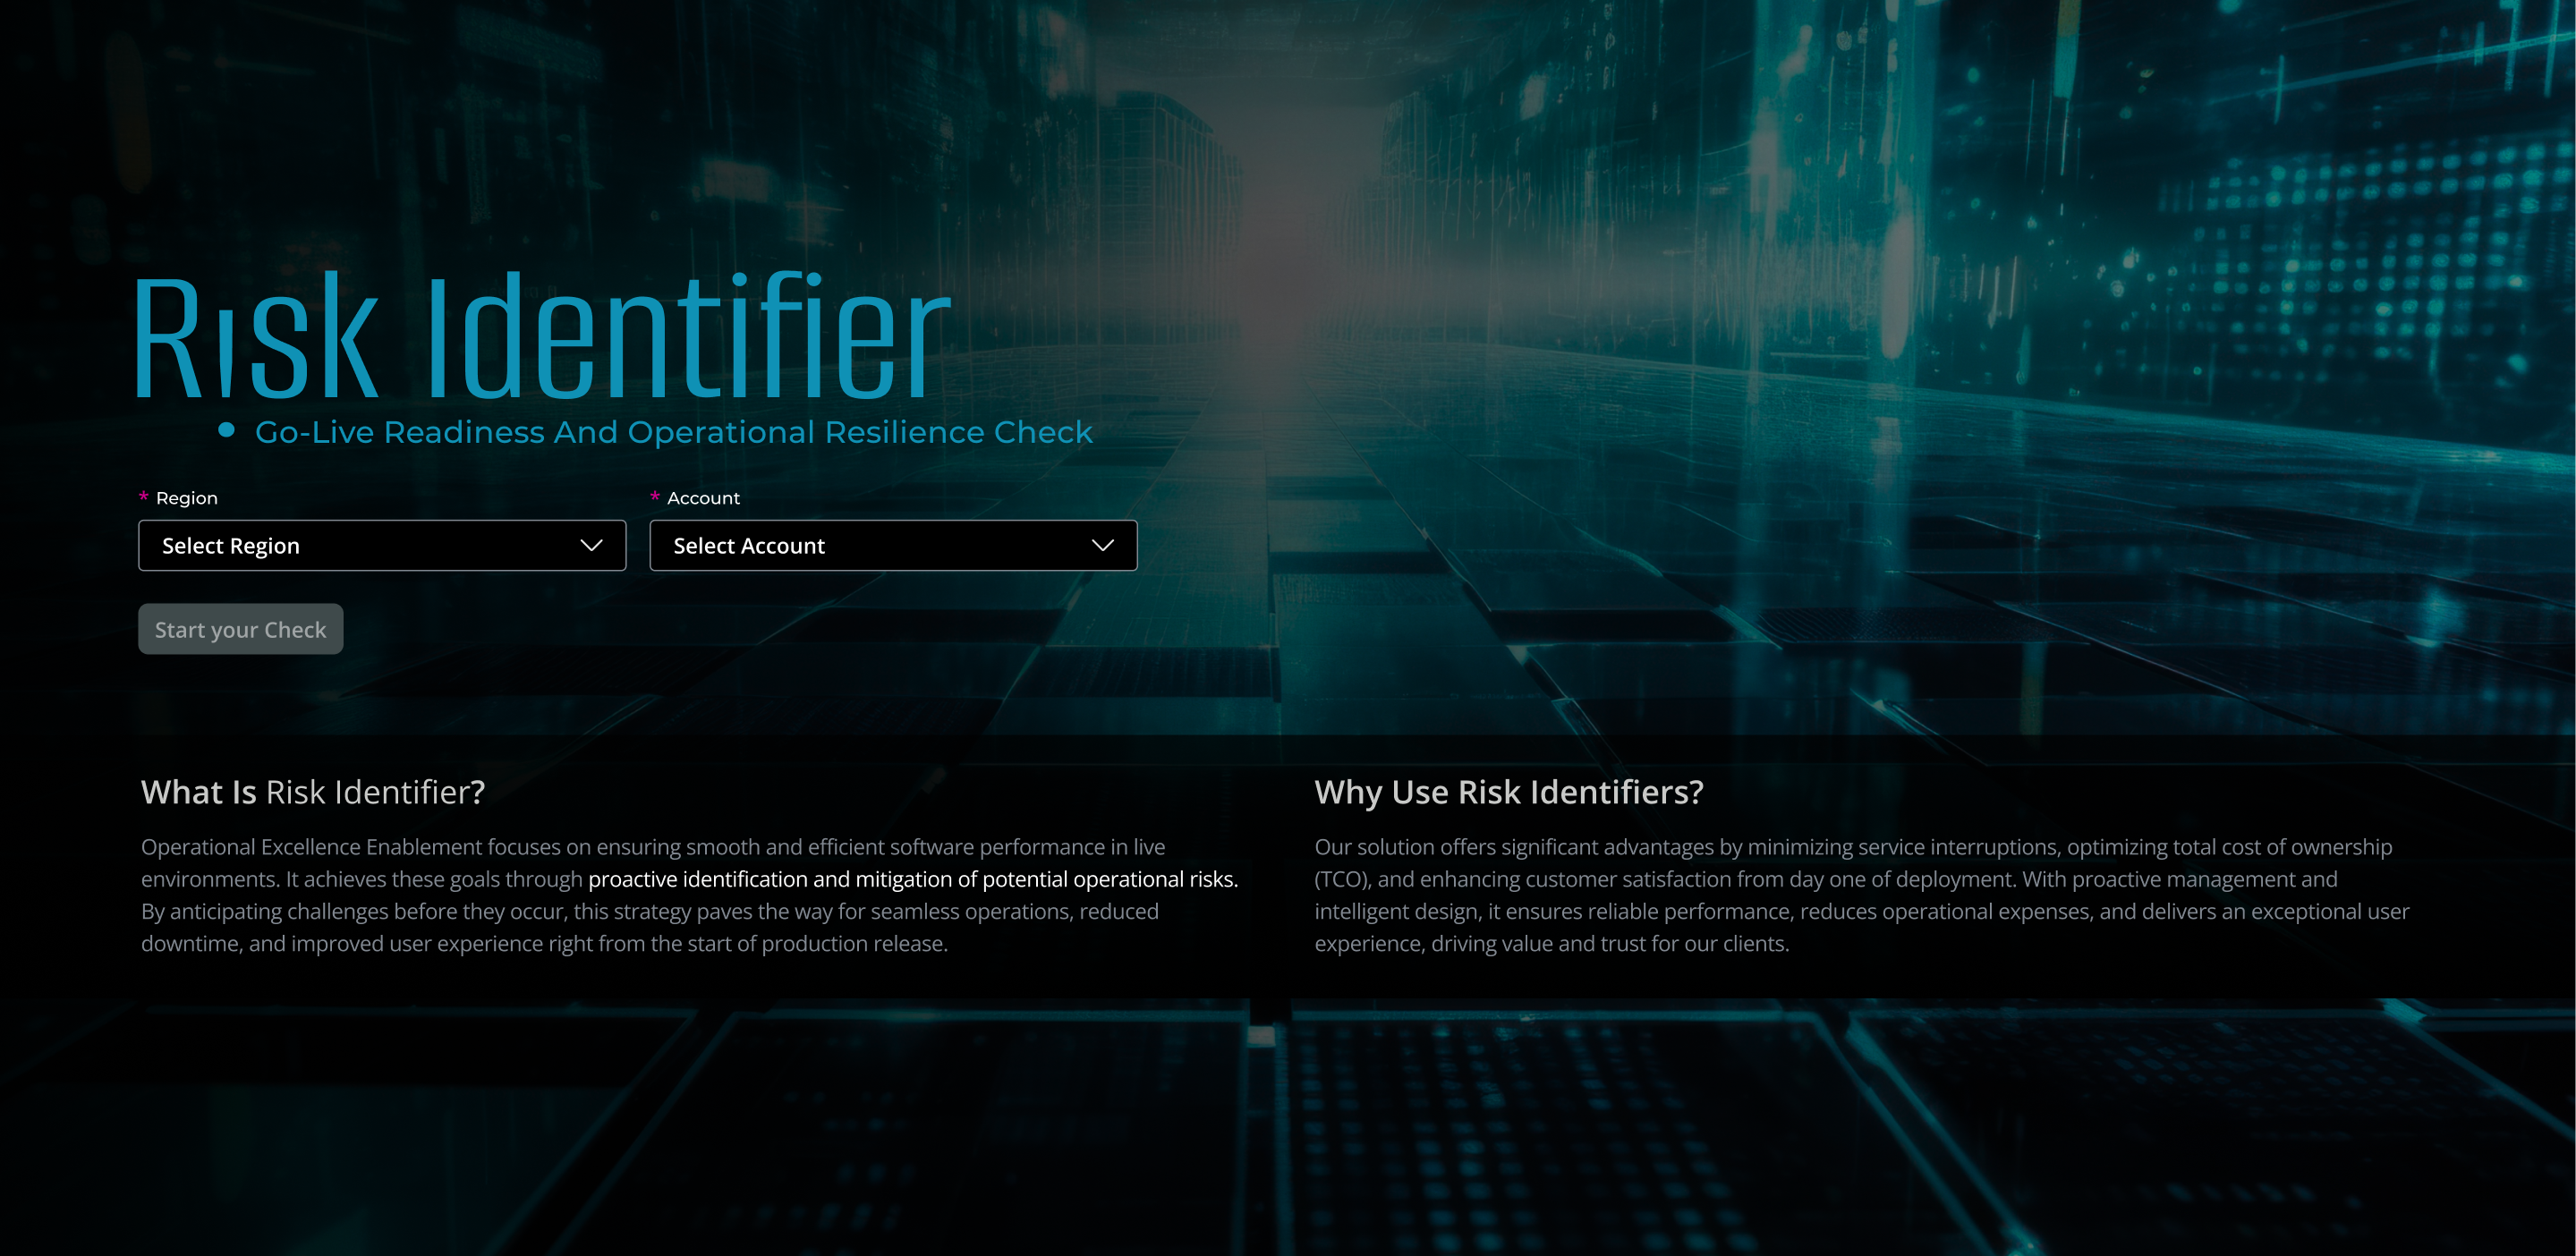
Entry Screen
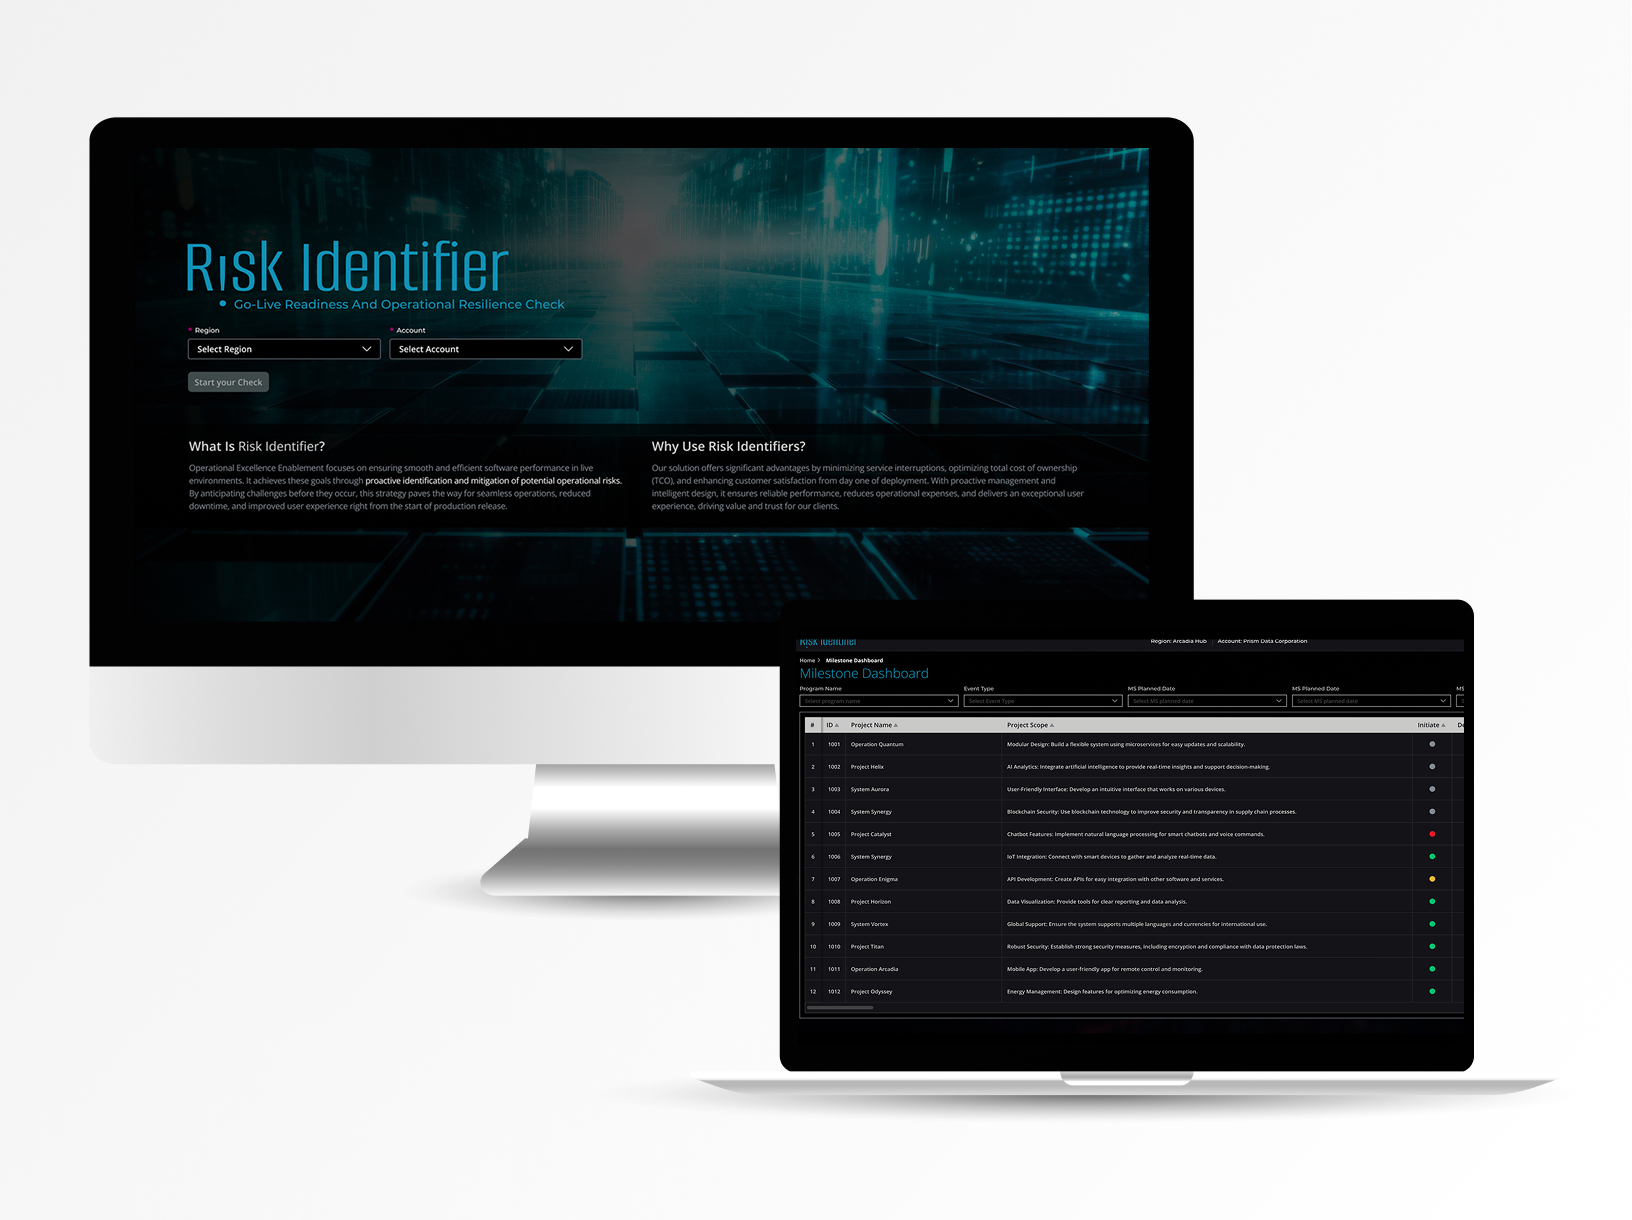
This entry screen is designed to set context, build confidence, and guide users into action with minimal friction.
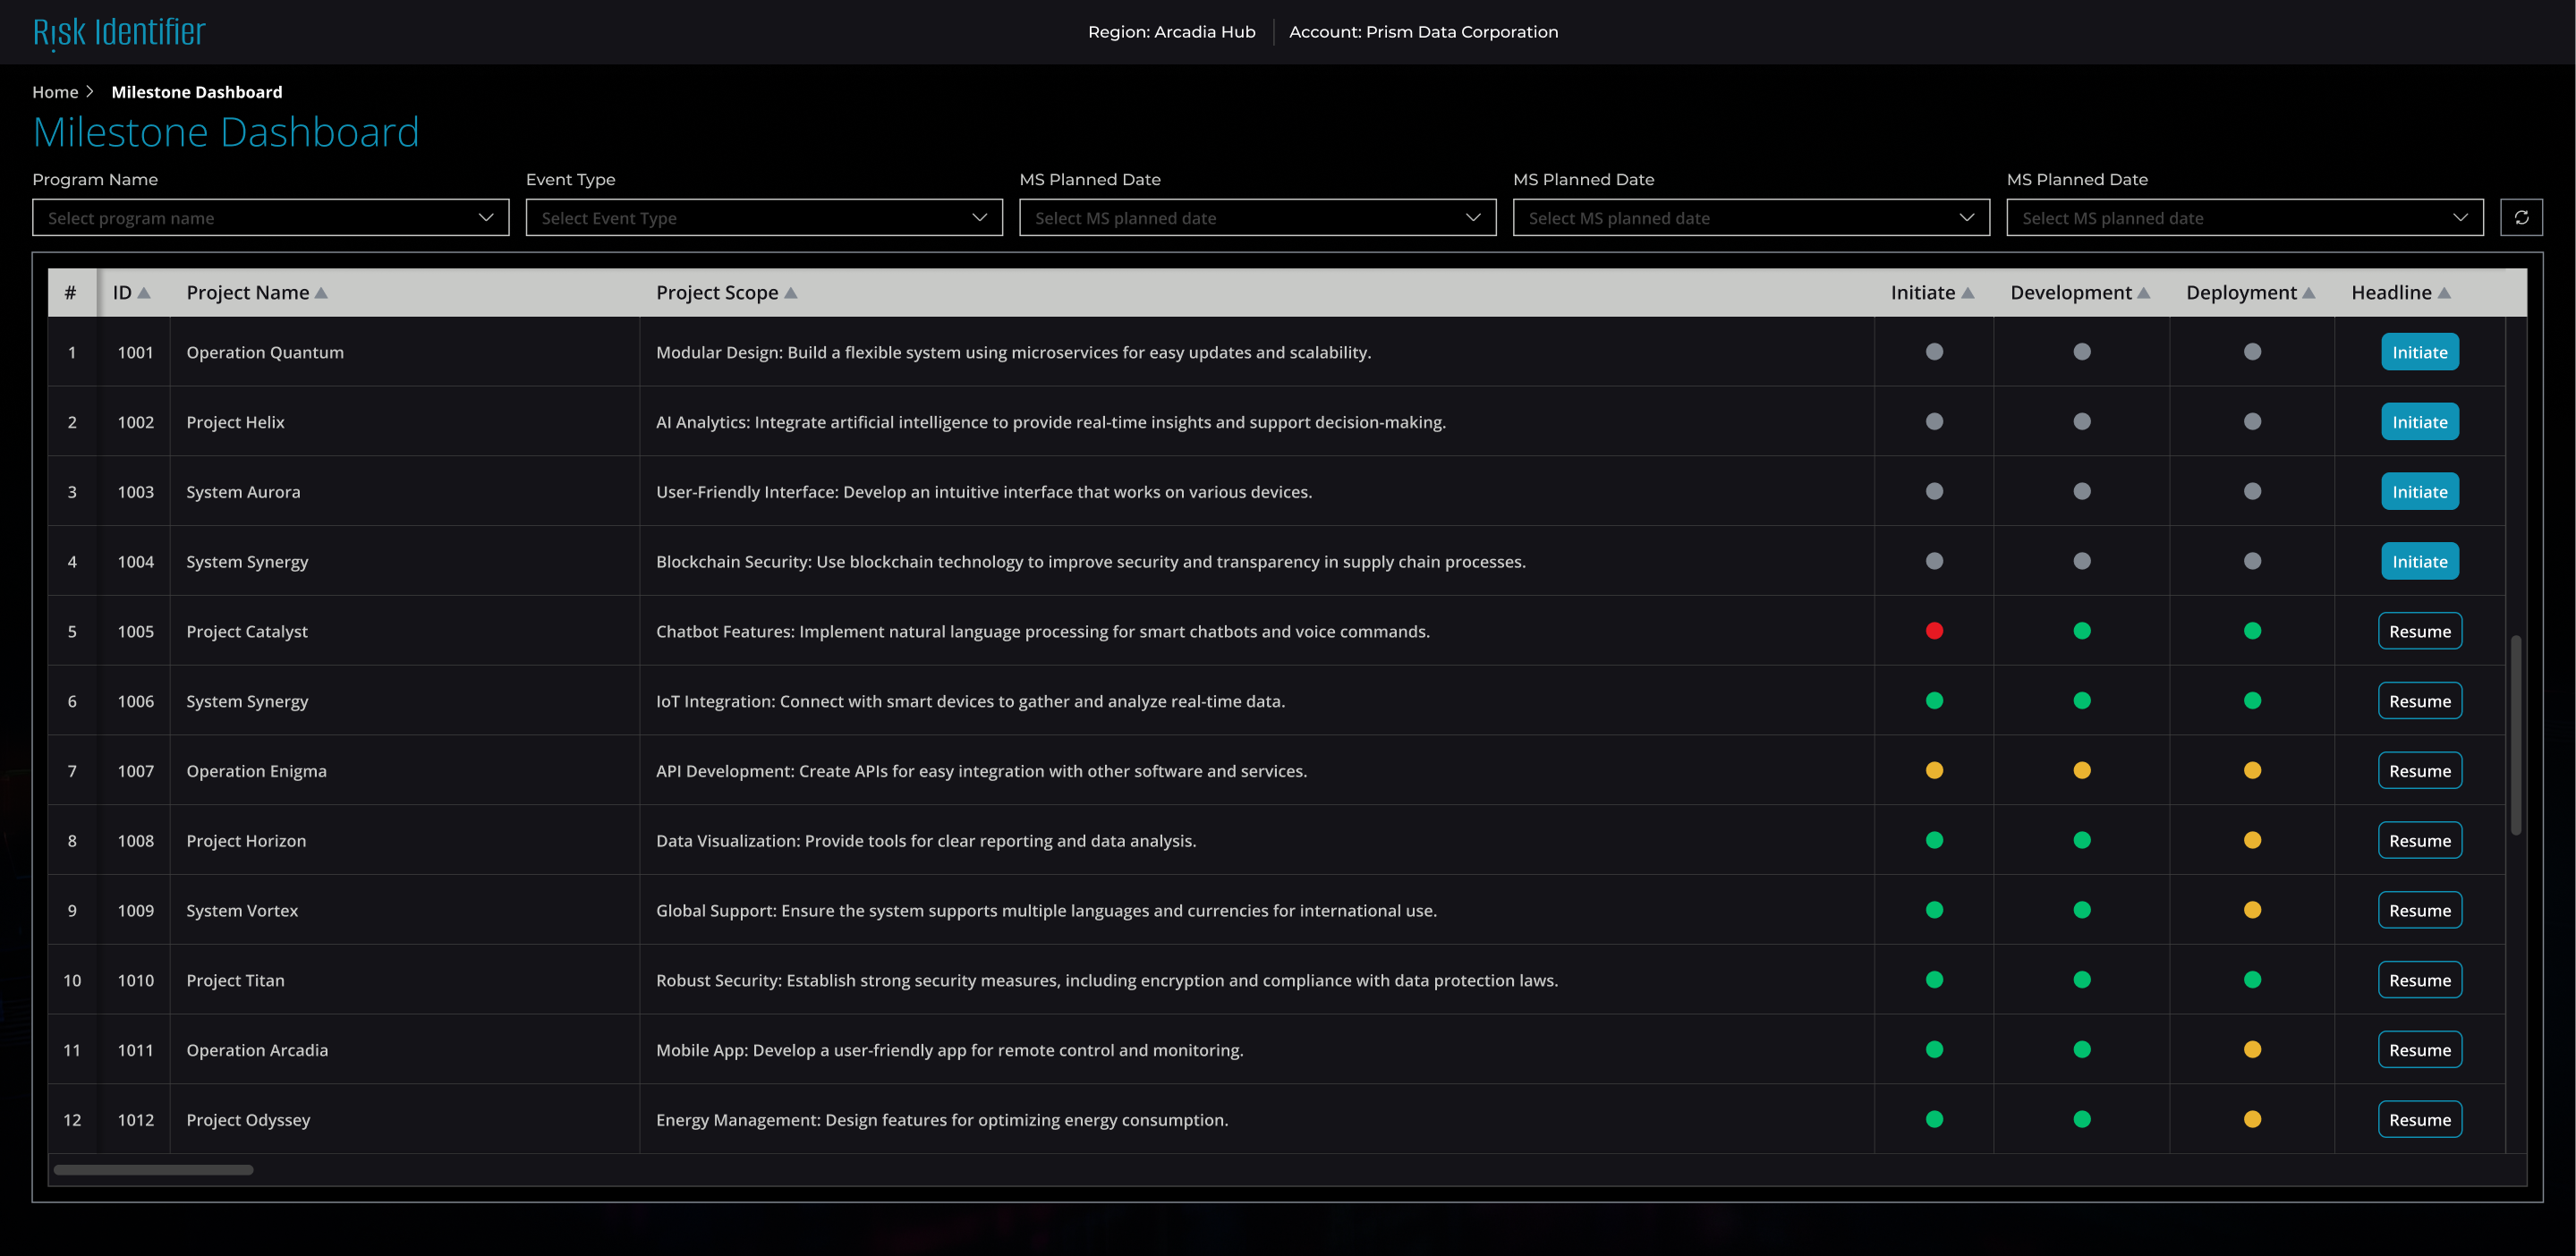

Dashboard:
This dashboard exists to give executives and PMOs a single place to see milestone health and delivery risk across all active projects, so they can intervene early, prioritize decisions, and keep the portfolio on track
Setting Up a Project Checkpoint:
This screen is designed to help users initiate a project checkpoint quickly, accurately, and with minimal cognitive load.
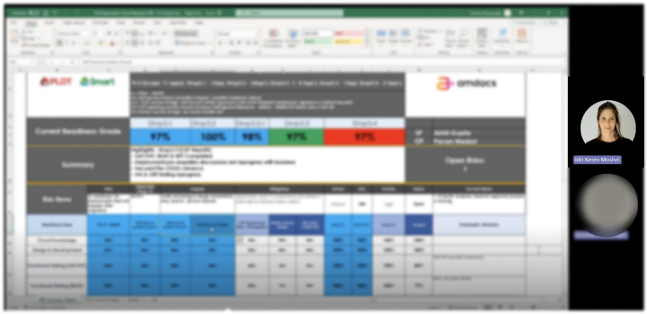
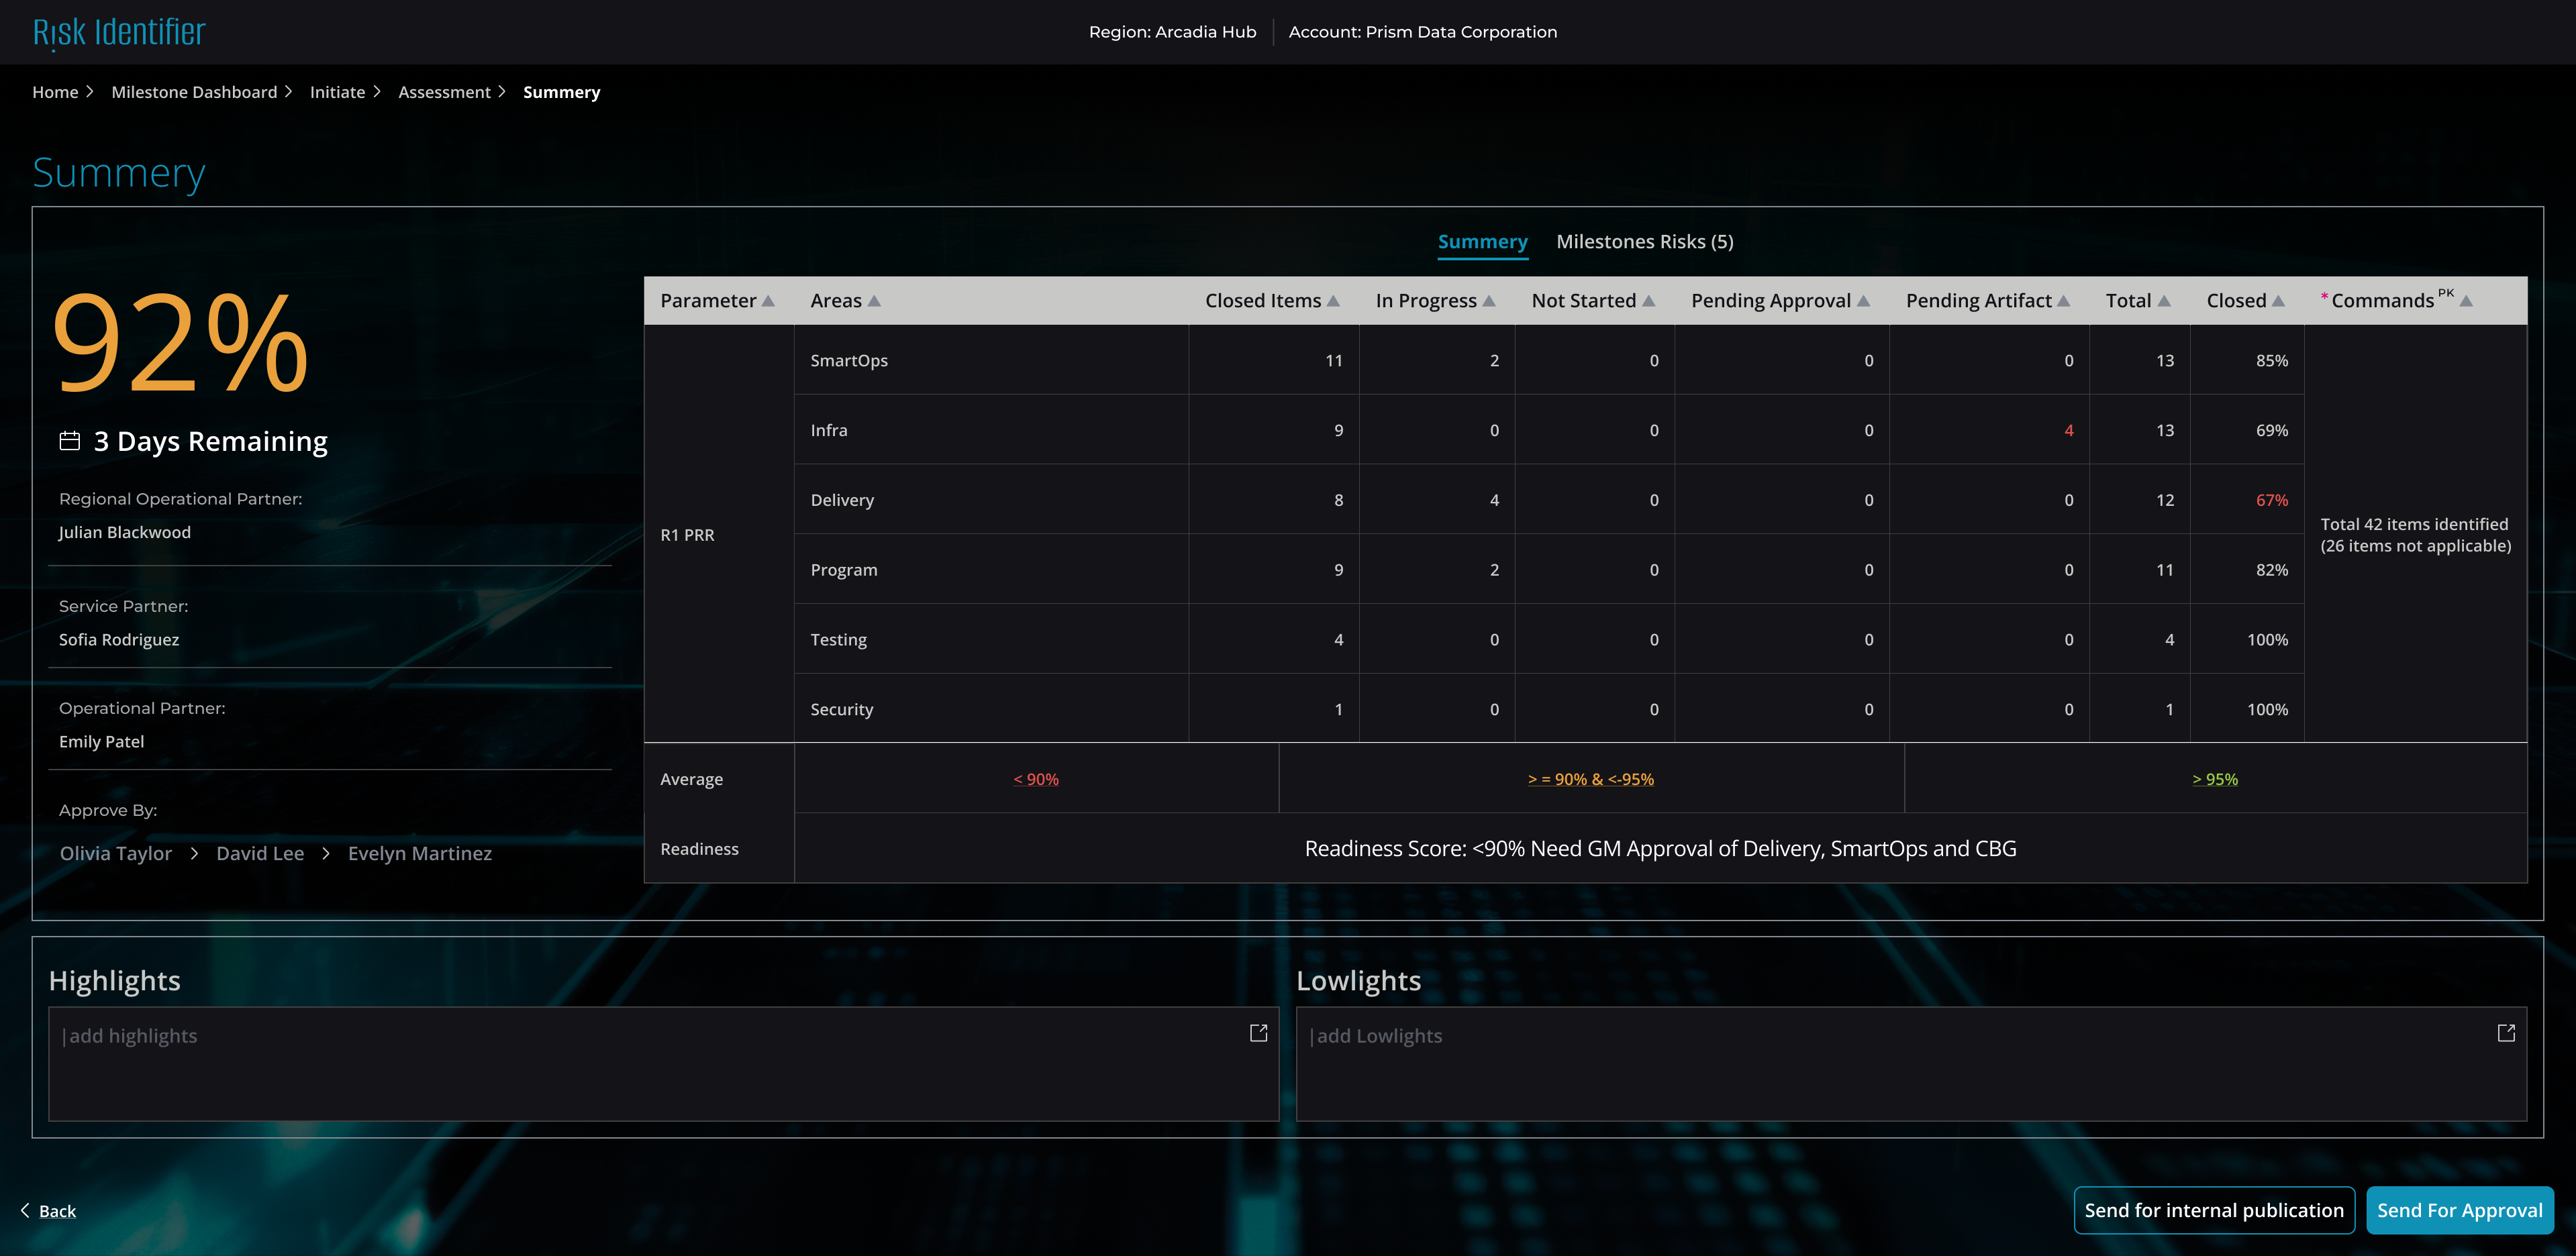
Summary & Readiness View:
Gives executives a quick overview of all projects at a glance. Drill down for details when needed.

Outcome
- Reduced Risk Discovery Time
- Proactive Resource Allocation- resources (architects, QA) are assigned before deadlines slip, not after—preventing last-minute firefighting and budget overruns.
- Single Source of Truth--Eliminated fragmented status updates across multiple Excel files and email chains
- Improved Stakeholder Confidence